


As data continues to be an integral part of business decision-making, tools that help visualize and analyze this data have become increasingly important. One of these powerful tools is Power BI, a business analytics tool developed by Microsoft. This post will guide you through the dynamic capabilities of Power BI, the challenges often faced when integrating maps onto Power BI dashboards, and how Â鶹´ĺ makes it easy to overcome these challenges.
PowerBI: A Game-Changer for Businesses
Microsoft Power BI is a robust business analytics tool that transforms raw data into meaningful insights. It offers interactive visualizations and business intelligence capabilities with an interface that is easy to understand for the average business user. Power BI allows users to create reports, dashboards, and share them with others within the organization. It also supports data connectivity meaning it can extract data from various sources making it a versatile tool for businesses of all sizes.
Challenges in Integrating Maps onto Power BI Dashboards
Despite Power BI's many strengths, integrating maps onto its reports and dashboards can be challenging. The built-in mapping capabilities are quite basic and can be limited when it comes to displaying complex geographical data. In addition, there can be compatibility issues between certain map formats and Power BI, which adds another layer of complexity. These challenges can make it difficult for businesses to truly leverage the power of spatial data in their decision-making processes.
Using Â鶹´ĺ to Simplify Mapping in Power BI
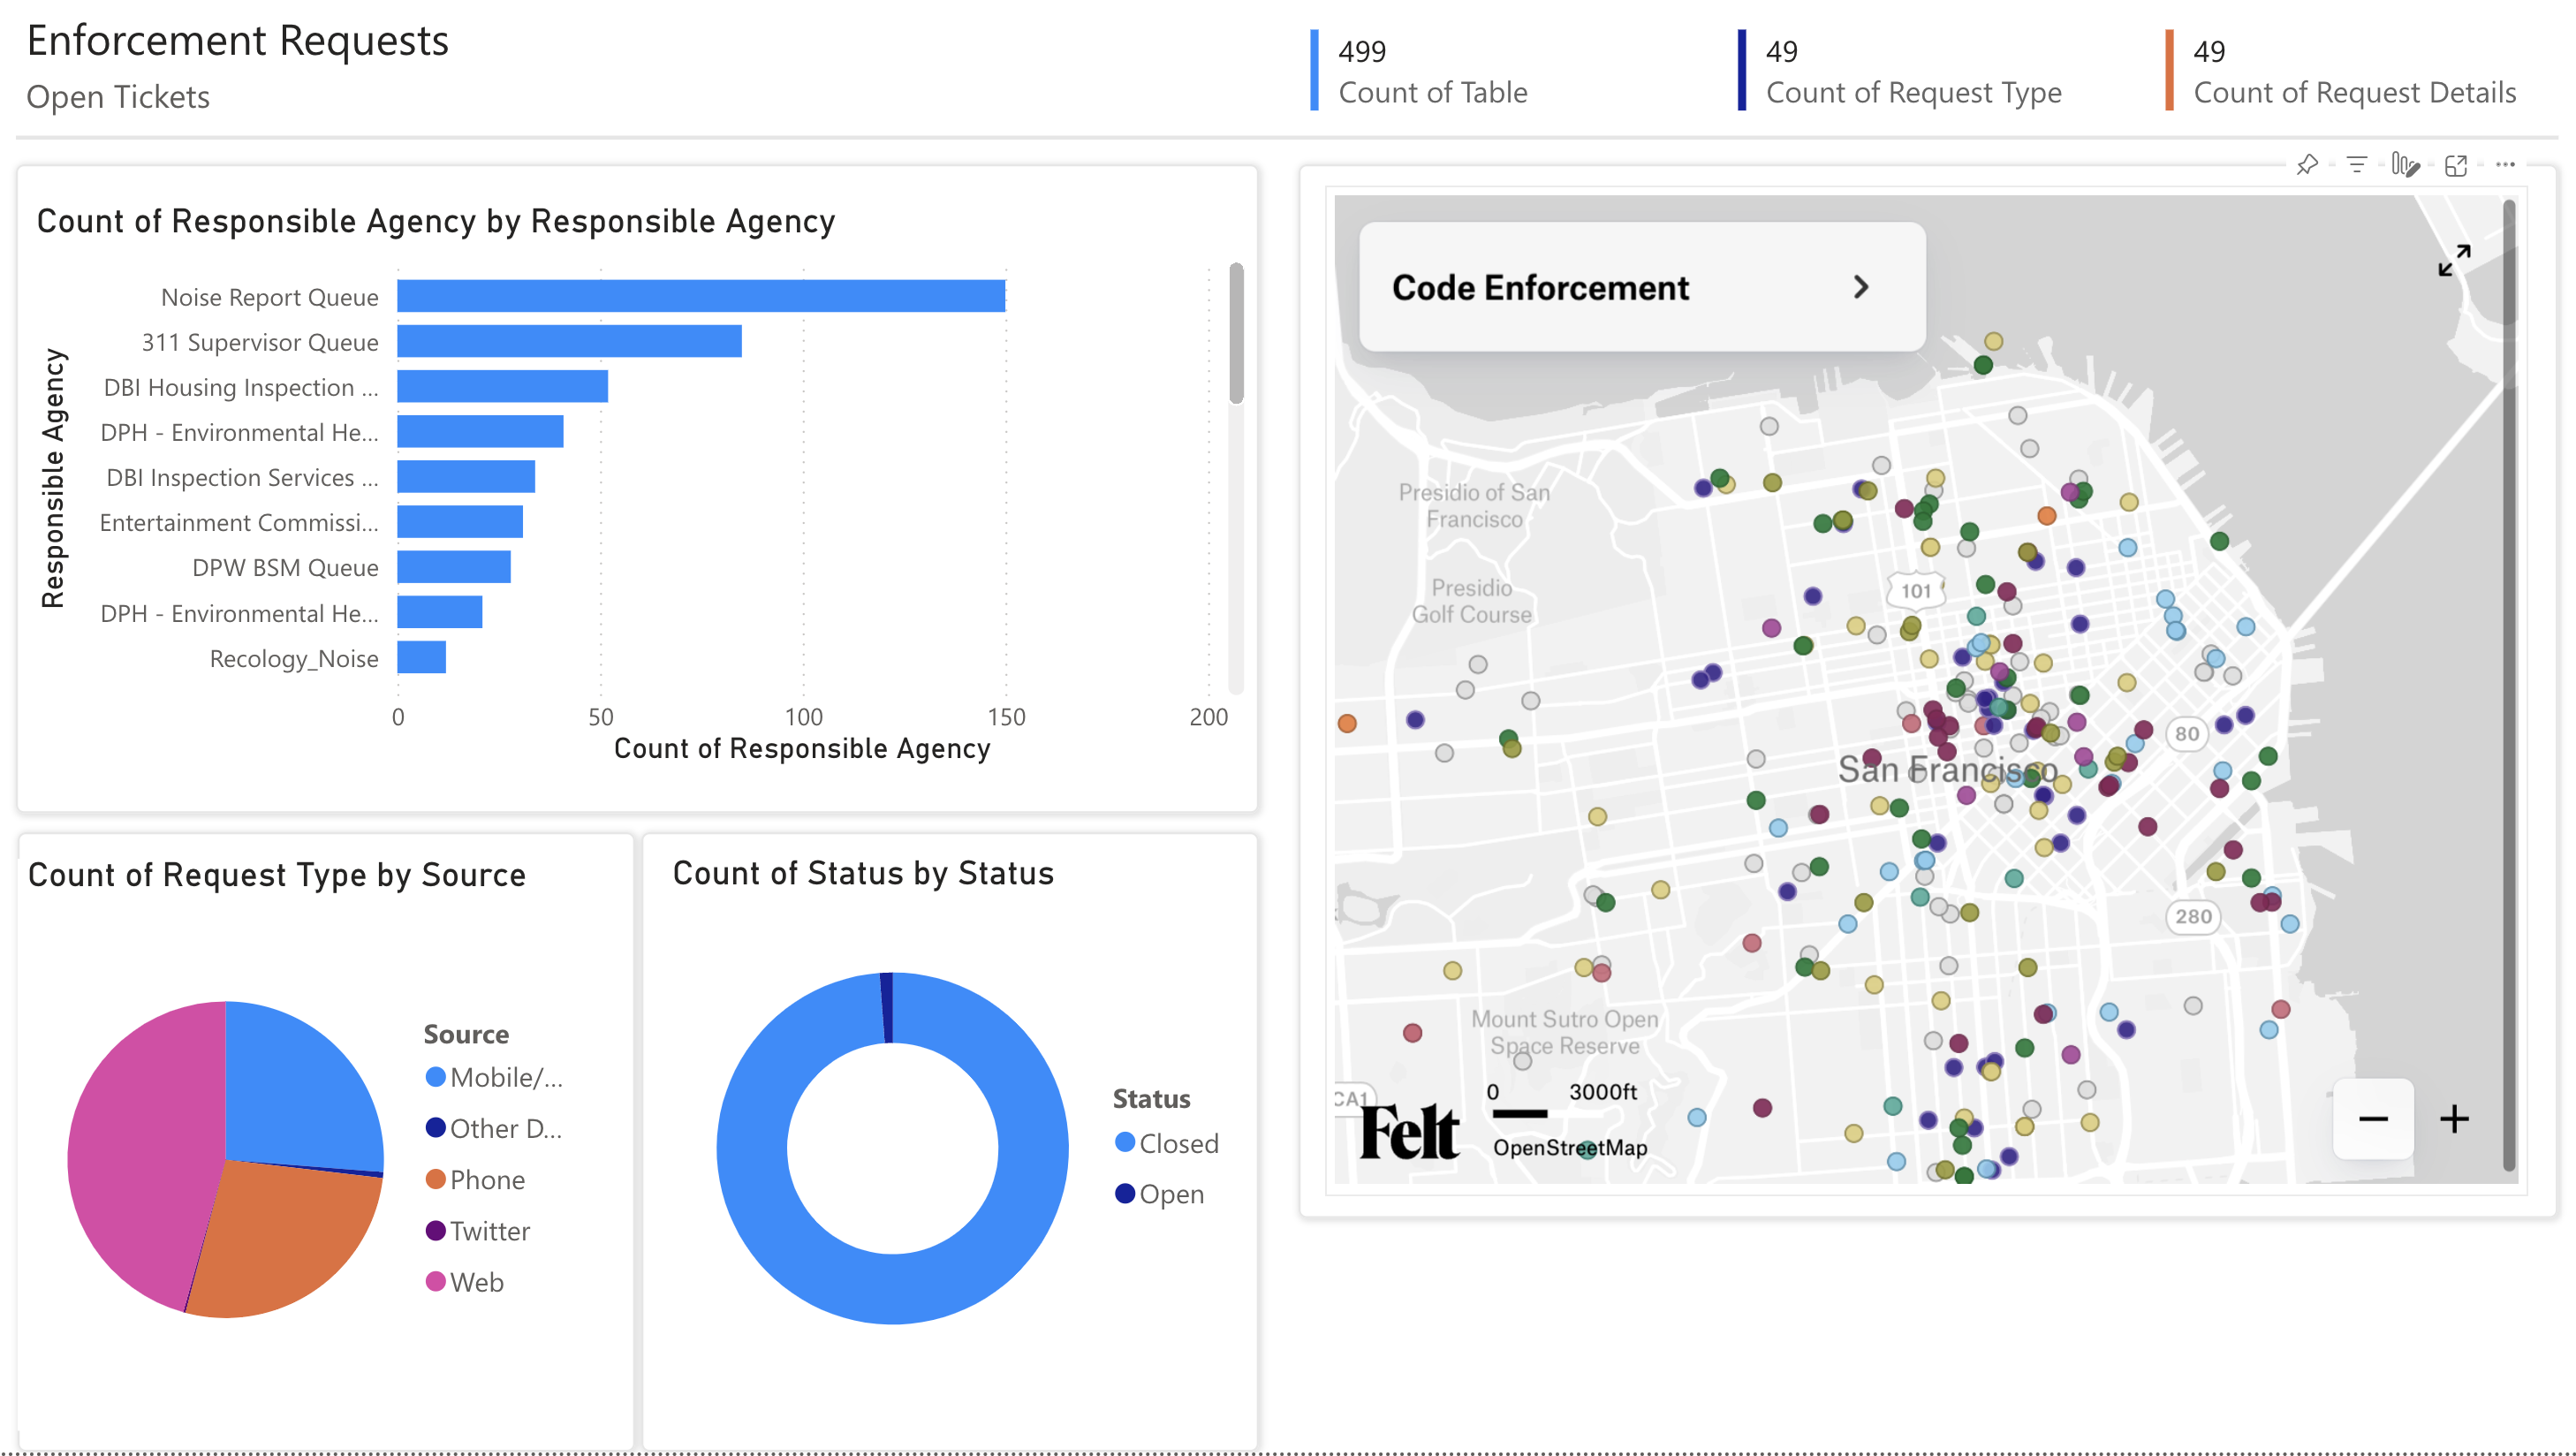
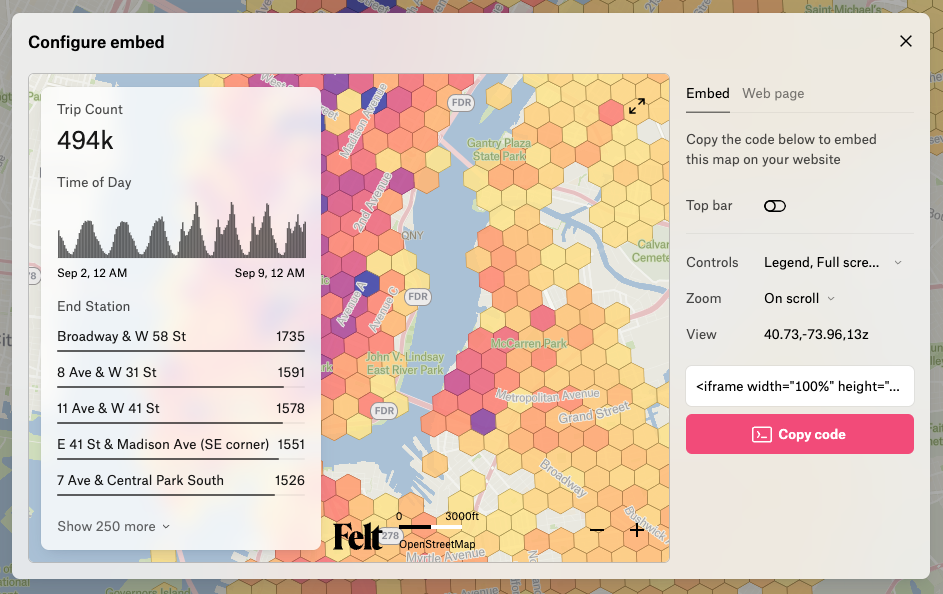
Â鶹´ĺ simplifies the process of integrating maps onto Power BI reports. Â鶹´ĺ supports a variety of map formats, ensuring compatibility with Power BI, and its intuitive interface makes it easy even for non-technical users to create and share maps. It also allows you to add layers, markers, and tooltips to your maps, providing a richer and more interactive experience for the end user. Once you've signed up and built your interactive map, navigate to <p-inline>File > Embed > Copy code <p-inline>. Add this code as a column in your data.
In Power BI, the steps are easy:
- Go to <p-inline>Get more visuals<p-inline> in the Visualization menu
- Add the HTMLÂ Content App
- Add a HTMLÂ Content visual to your map
- Select the column that contains your Â鶹´ĺ map iFrame code

Try it now
Power BI has become an essential tool for businesses, allowing them to turn raw data into actionable insights. However, the challenges associated with integrating maps onto Power BI dashboards can limit its effectiveness. Thankfully, tools like Â鶹´ĺ are making it easier for businesses to overcome these challenges, enabling them to fully harness the power of spatial data in their decision-making processes. To test Â鶹´ĺ’s Power BI integration, book time with our technical experts here.


